QLM Cloud Intro - Part 5
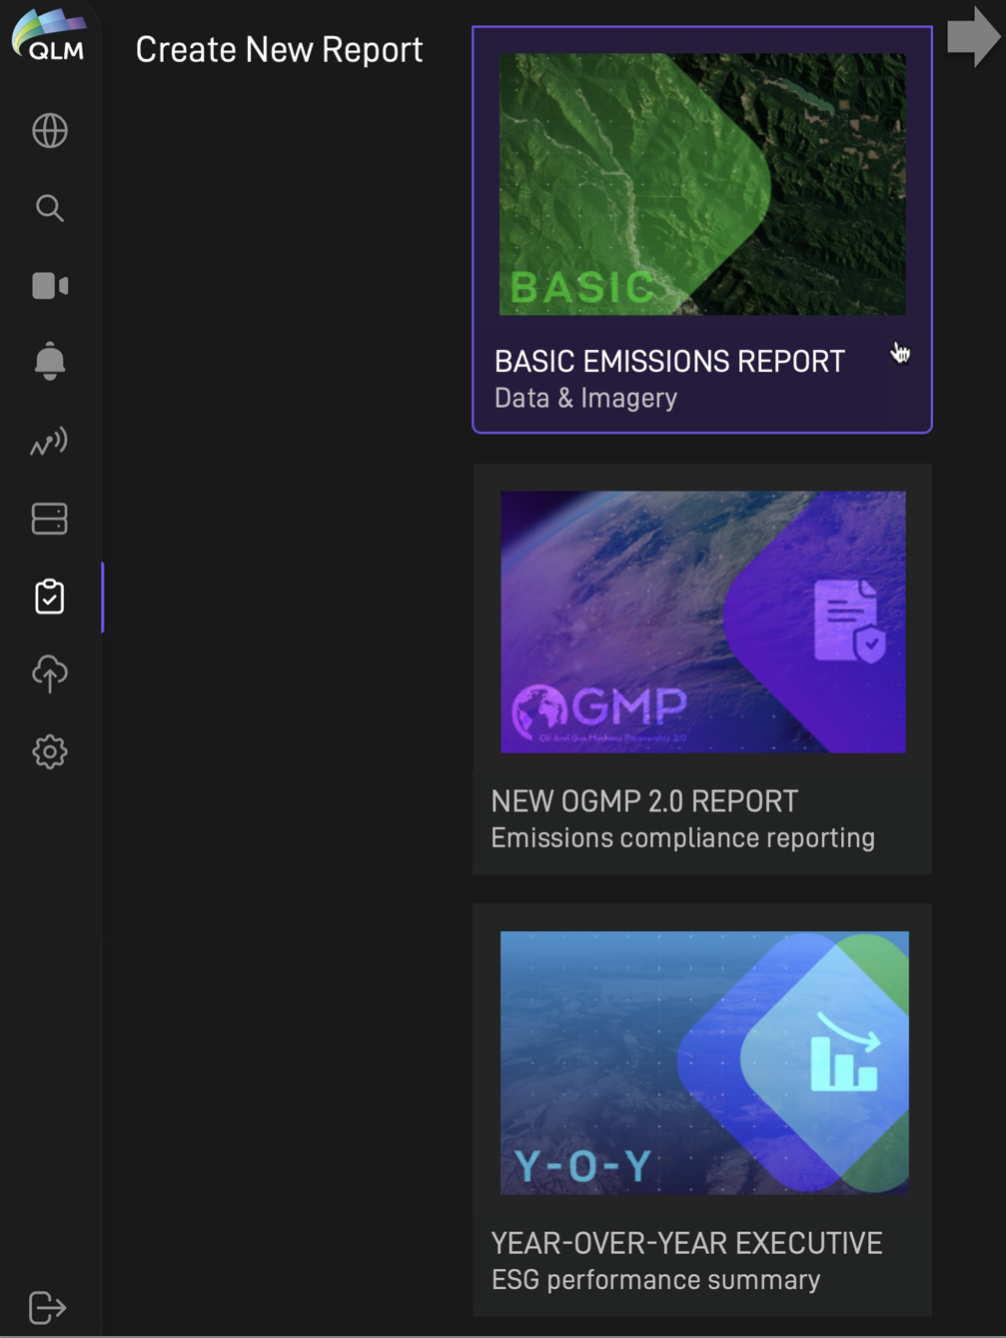
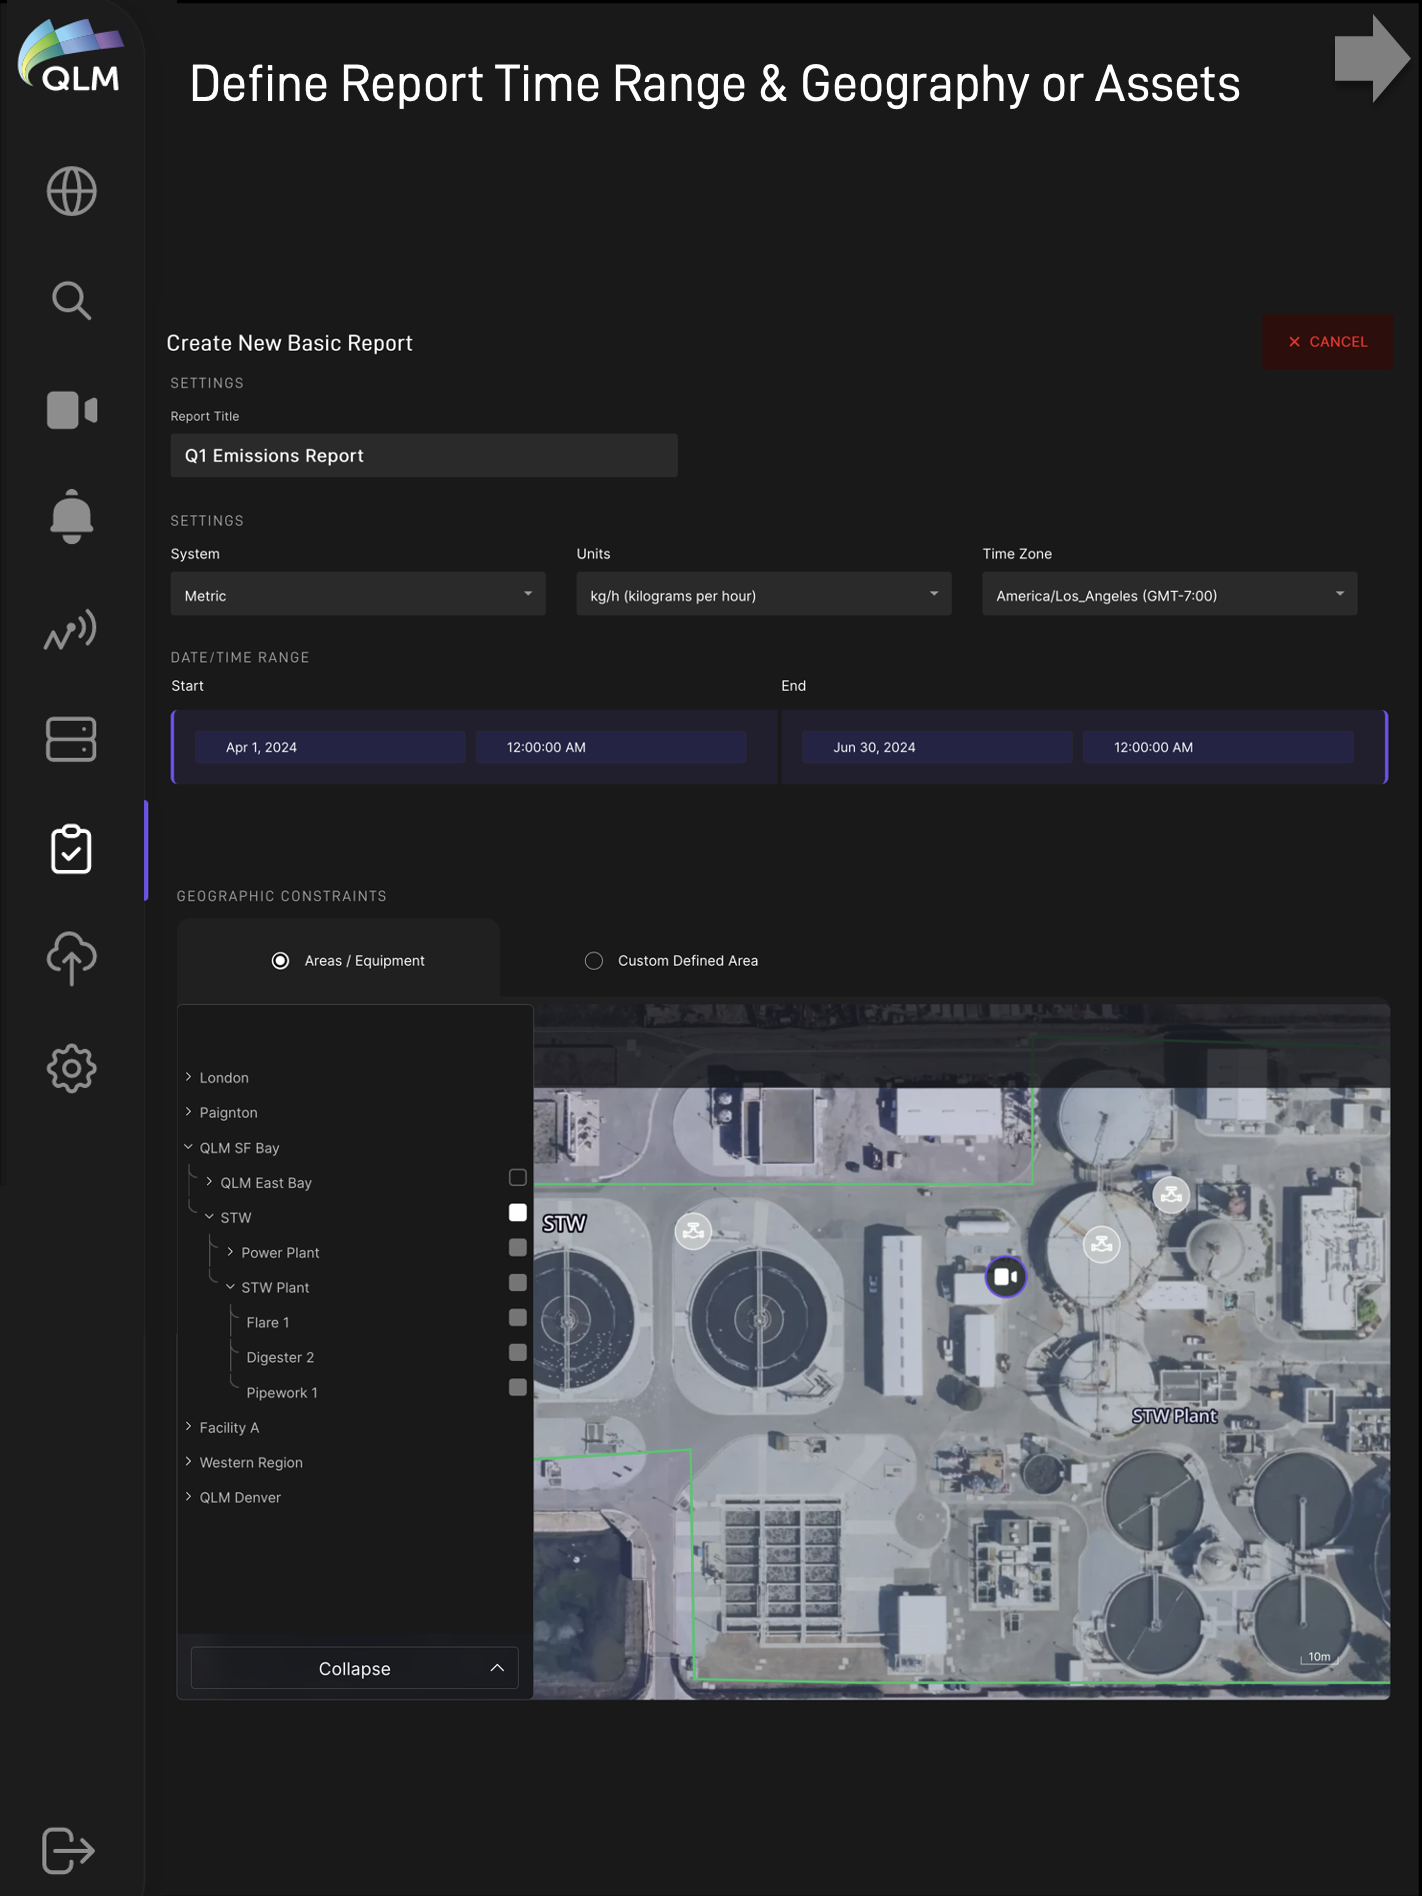
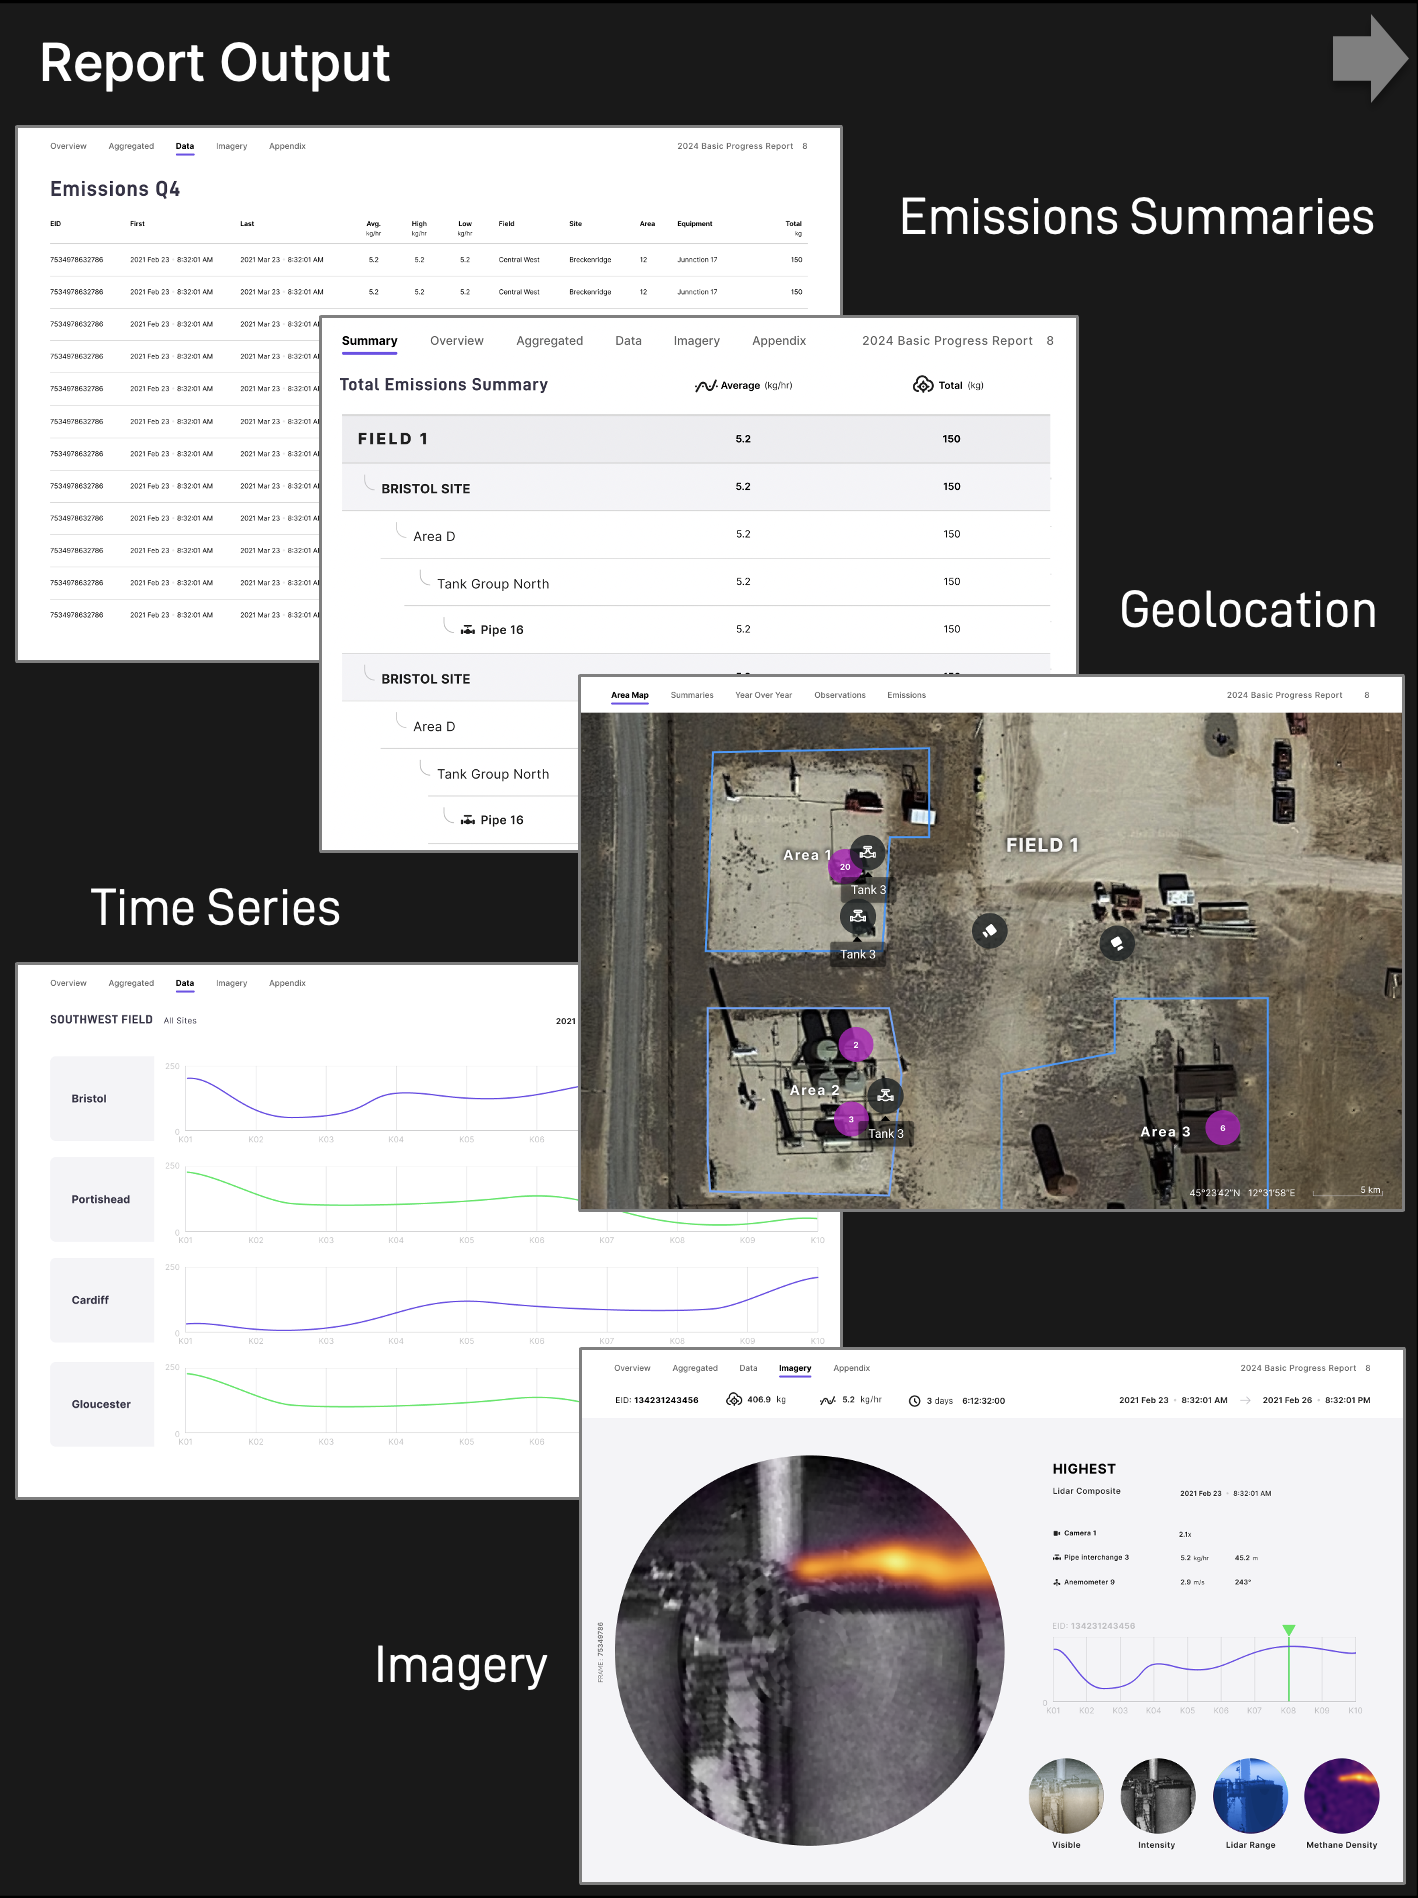
Plume of the Week! Continuing our QLM Cloud workflow walk-through, here we showcase our full reporting and automated alerting capabilities. Site emissions data has both geographic and temporal dimensions and so our reporting allows users to get summarized emissions information by specifying date/time constraints combined with geographical constraints (via user-defined geofence, GIS boundary or selected assets). In customizable report templates, outputs can be configured to include various imagery, time-series emissions plots and tabular summaries.
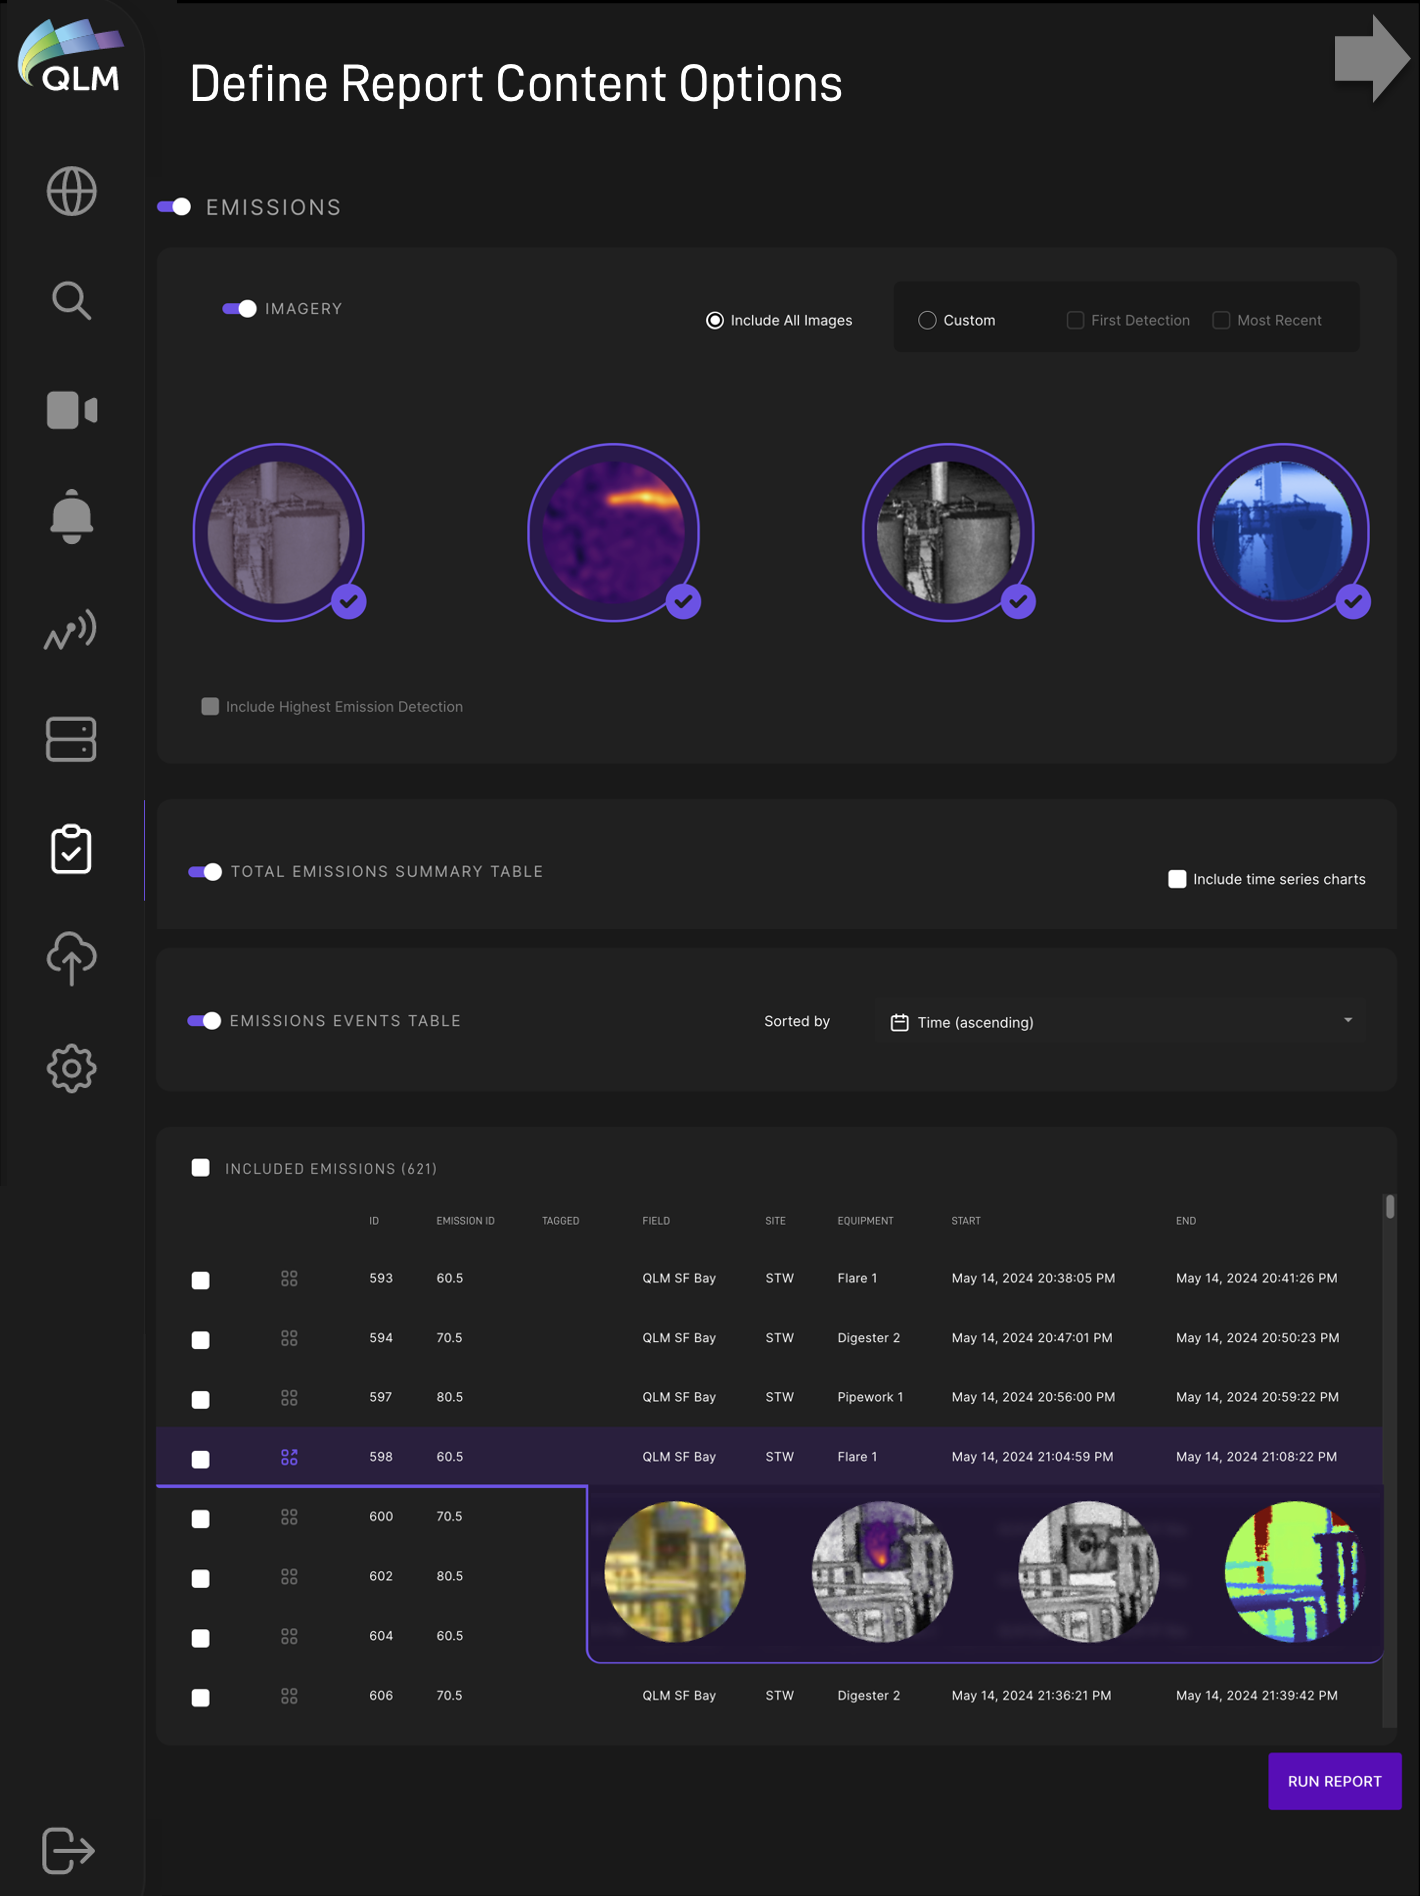
There are a variety of outputs available including PDF summaries, image files, txt/json/csv outputs of all metadata.
For customers who want the QLM emissions data to pipe directly into their database or system of record, customizable APIs are also available to streamline integration with existing reporting systems.
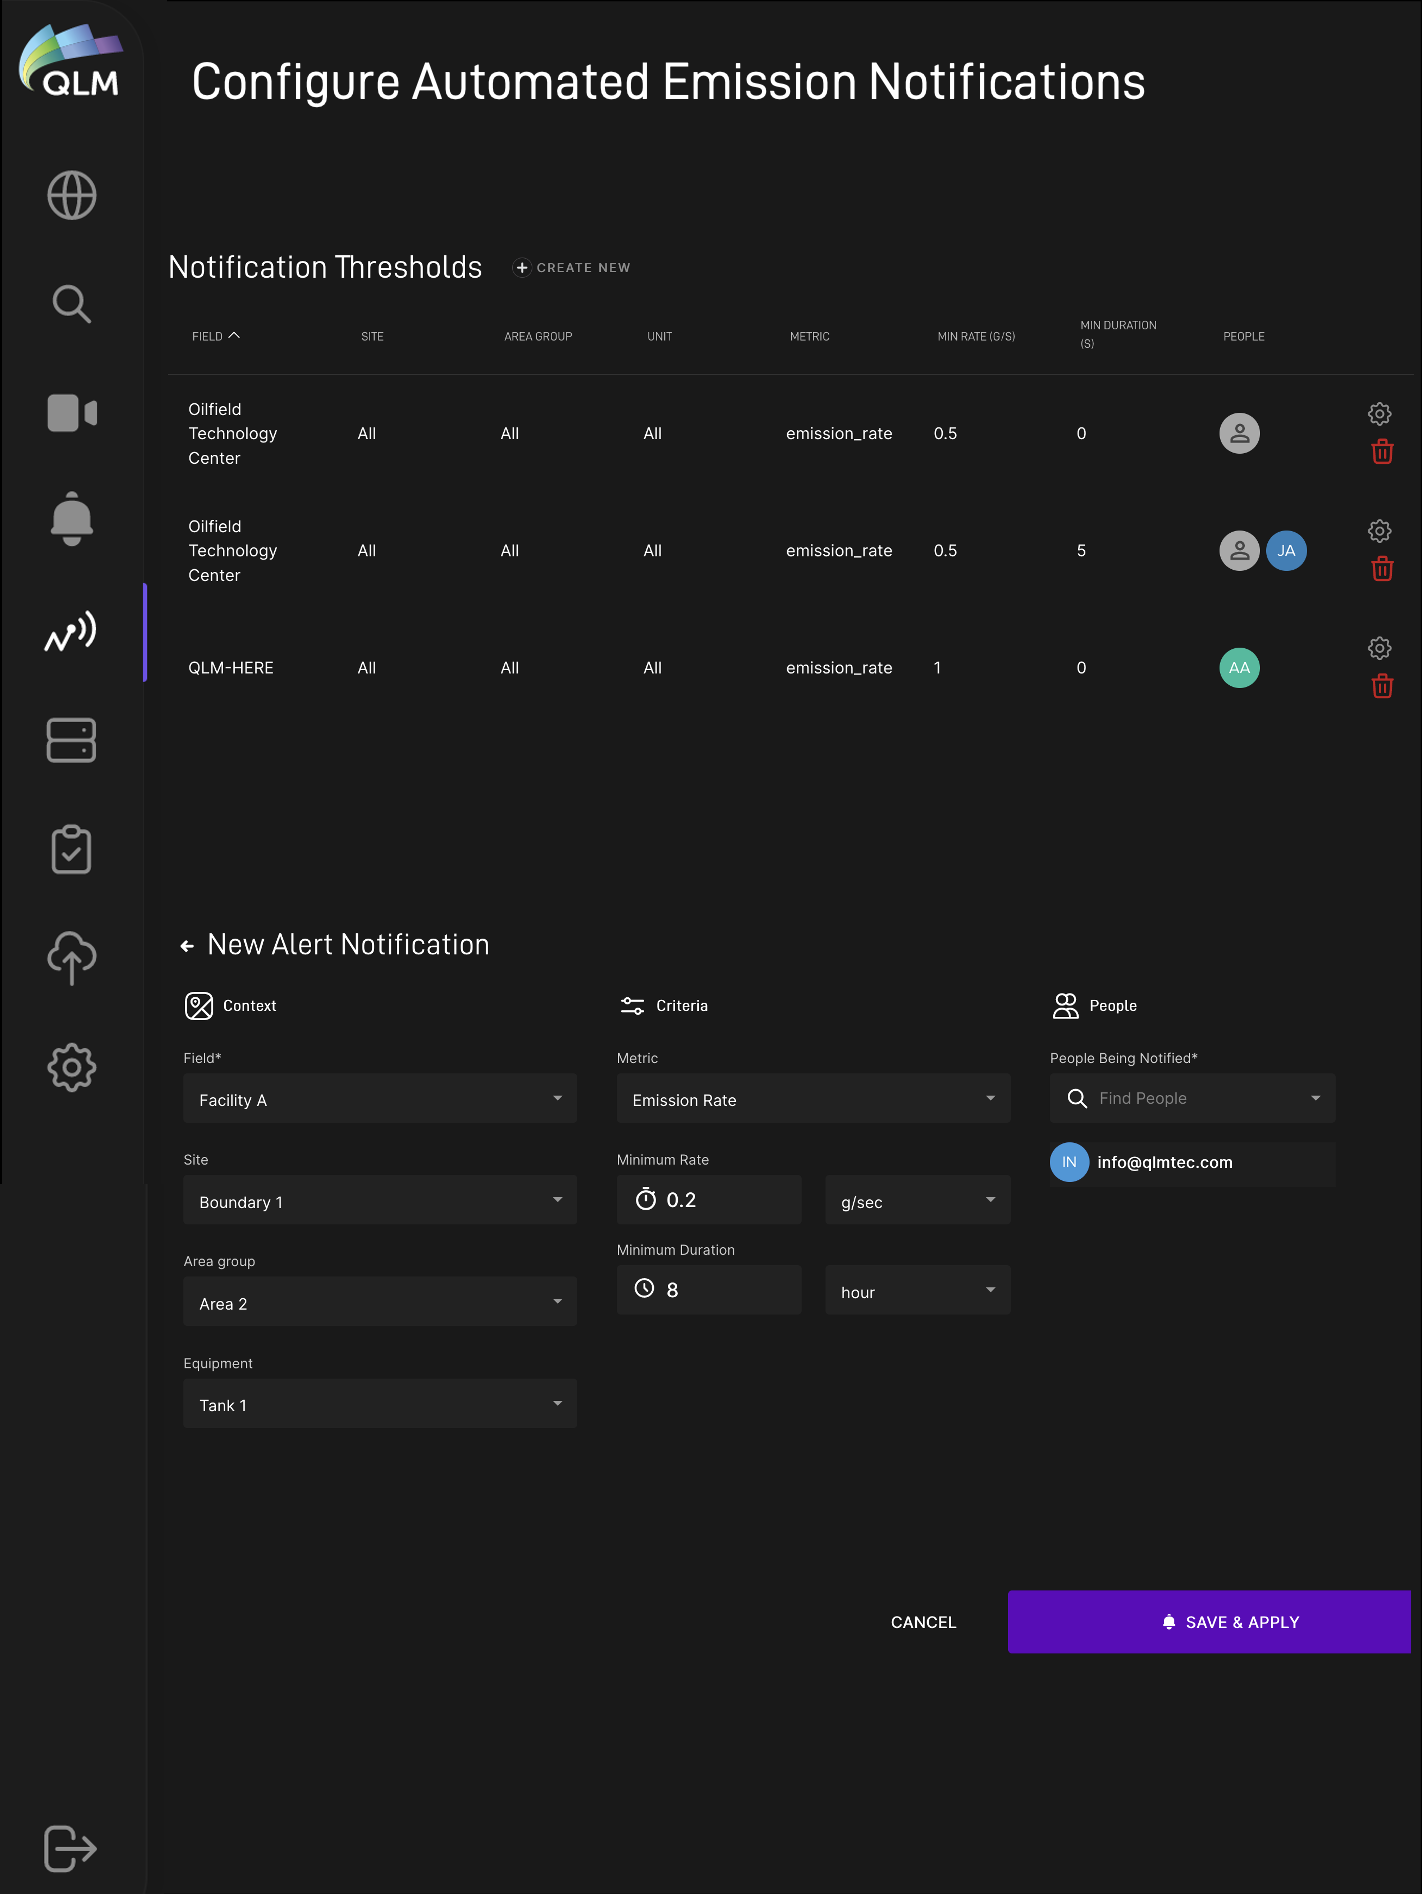
Additionally, automated text message or email alerts can be configured to send notifications for user-specified emission exceedances (thresholds of emission rate, emission duration or both can be set) across an entire site or on specified equipment.