Oil & Gas: Repsol Sinopec lidar camera trial advances methane emissions  detection

Oil & Gas: Repsol Sinopec lidar camera trial advances methane emissions detection

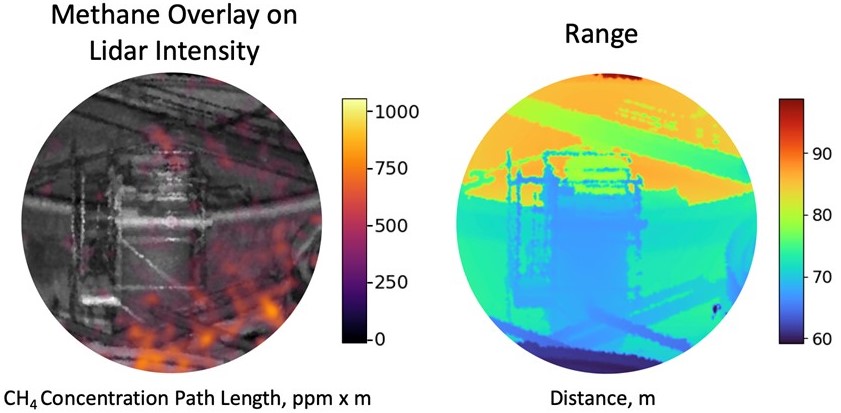
Lidar technology proved accurate and instrumental to identifying and quantifying fugitive methane emissions at the Flotta Oil Terminal off the coast of ScotlandRepsol Sinopec Resources UK Ltd. (Repsol Sinopec) wanted to identify and quantify methane emissions at the Flotta terminal site. Committed to lowering fugitive emissions, Repsol Sinopec initiated a trial using methane lidar camera technology that uses tunable diode laser imaging, detection, and ranging to visualize and quantify methane emissions. The trial was jointly conducted by SLB and QLM Technology Ltd. The intent was to Over the weeklong trial, two methane lidar sensing systems were deployed on platforms at heights of up to 20 m to facilitate measurements at numerous positions across the terminal. A thorough lidar scan of the terminal revealed a few methane emissions. However, the emission rates quantified by the lidar equipment were too small for detection by some conventional fugitive emission monitors.A minor emission detected from a valve on pipework surrounding pressure control valves at ground level in the processing area. This emission was only observed for a short period of time, making it unlikely to be detected during a walkover survey. The left image shows a colorized methane plume on greyscale lidar image. The right image shows corresponding distances to solid objects, measured by the lidar simultaneously with the lidar gas imagery. The diffuse emissions from an open-top effluent tank were able to have their flow rate quantified despite not appearing as a hot spot of methane concentration. Because the tank emissions are not from a point source, they appear as areas of higher and lower concentration across the image. The left image shows a colorized methane plume on greyscale lidar image. The right image shows corresponding distances to solid objects, measured by the lidar simultaneously with the lidar gas imagery. The methane lidar systems achieved“Repsol Sinopec is committed to accurately measuring and quantifying our methane emissions and eager to assist in the development and trialing of new technologies in this area. We were delighted to host the successful trial of the methane lidar sensing system at Flotta terminal. Not only, we believe, did the trial provide QLM Technology Ltd. and SLB with valuable information, but the results gained provided ourselves with detail on top-down methane emissions, and also afforded further reassurance that we are operating the Flotta Terminal in a manner that prioritises the safety of our people and the environment “ Catherine Sherwin, Technology Lead, Repsol Sinopec Resources

May 15, 2023
Read Study

Case Studies

Oil & Gas: Emissions Monitoring & Quantification at National Gas Transmission

Oil & Gas: Emissions Monitoring & Quantification at National Gas Transmission

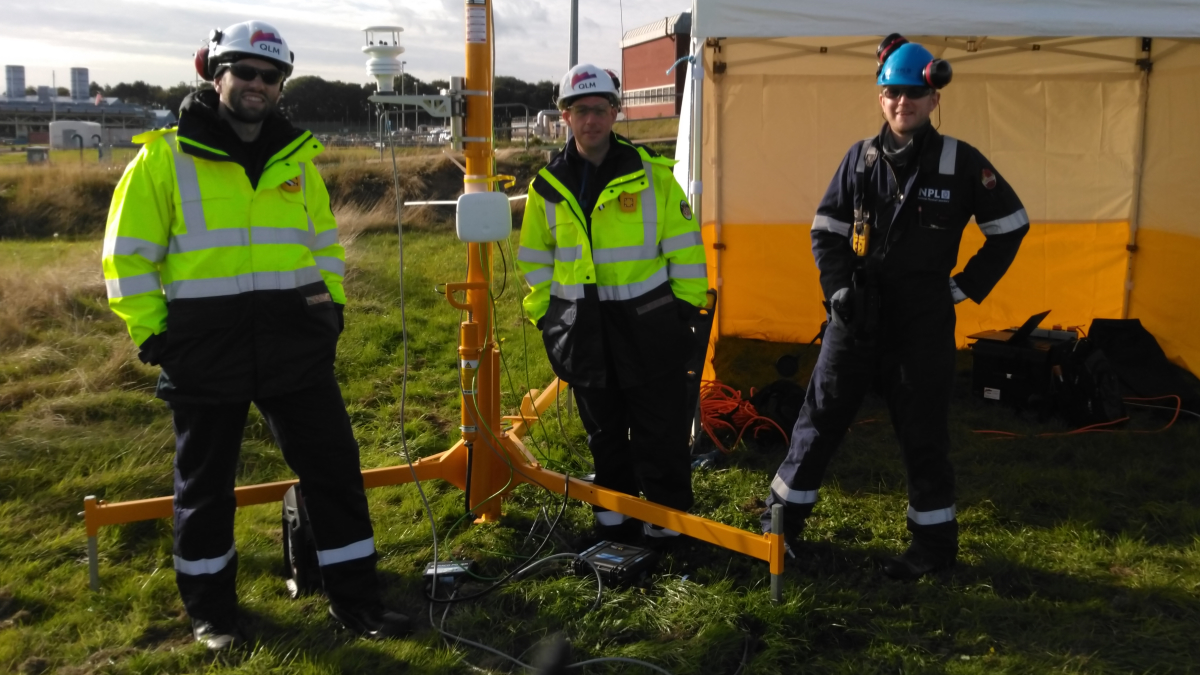
National Gas Transmission (NGT, formerly National Grid Gas) is responsible for maintaining the UK’s nearly 8000 km of natural gas (NG) pipeline, served by over 600 above ground stations. On the eve of COP26 in October 2021, QLM carried out the first trial of the quantum gas lidar at a real-world site at NGT’s Bacton Terminal, supported by the National Physical Laboratory (NPL).QLM Physicist Chris Goldsack (left) and Global Applications Lead Dr Doug Millington-Smith (centre), with NPL Senior Research Scientist Jon Hemore (right) at the Bacton site.The trial of the lidar in a fixed emplacement at Bacton terminal focused on surveying for leaks and quantifying emissions on a portion of the site, while NPL carried out traditional walkover leak survey using industry standard methods of OGI and handheld “sniffers”. The comparison between QLM’s continuous monitoring and the traditional snapshot-in-time study were of particular interest to NGG’s decarbonisation plans.The QLM study focused on above-ground emissions, finding several substantial emissions a few metres off the ground through the venting pipes attached to the assets. These were visible to the OGI lidar that NPL used, but could not be effectively reached with the high-flow sampler to give an estimate of leak rate due to the height above ground.Two emissions at height, visible but unquantifiable by the ground-based crew.Some of the emissions were persistent throughout the measurement period, and the QLM lidar was able to revisit these emissions several times over the course of the week and track any changes in their rate.The same emission monitored at two different times, showing good consistency of emission rateSeveral deliberate venting operations took place during the week, as out-of-commission equipment was purged with nitrogen, or specific spots of pressure were relieved. These often took place outside of the target survey area, or in locations with an unfavourable background for the lidar. Nevertheless, it was possible to quantify extremely large calculated flow rates of gas associated with these short, highly temporally resolved events, which the walkover study would be unable to seek to detect.Two planned venting operations, each lasting for a very short time – the size and duration makes them unsuitable for traditional walkover methodsSimon Smith, Operations Representative at NTG, said “As an operational site we are always keen to review new technology and see how it can be implemented into a live environment and improve safety on site. As well as the environmental impact with fugitive emissions we can also see a use for the camera during maintenance activities. We isolate large areas of plant to allow for assets to be inspected. To facilitate this we need to vent quantities of gas and ensure the ball valves providing the isolation are not passing. By using the (QLM) lidar we have been able to identify valves that were passing that would have previously gone unnoticed. We would be able to use this technology to monitor open vents and ensure the leak rate does not increase during intrusive works.”The trial was highly successful for QLM, identifying and quantifying emission sources from assets confirmed to be leaking by NPL, as well as characterising highly temporally-resolved venting operations across the site, which took place at heights and over short durations that a walkover survey would not be able to catch and quantify. The trial also identified areas for development from automation and end-user flexibility points of view, which have since been incorporated into the commercial release of the lidar.

October 29, 2021
Oil & Gas: Industrial Trials With TotalEnergies

Oil & Gas: Industrial Trials With TotalEnergies

One of QLM’s earliest industrial partners is TotalEnergies, who maintain a dedicated testing facility at TADI (Transverse Anomaly Detection Infrastructure) in Lacq, France. QLM was invited to take part in blind CH₄ emission monitoring tests run by TotalEnergies on their TADI platform in Lacq in October 2020. These trials involve leak detection and quantification equipment being set up around a dedicated zone that contains various typical industrial infrastructure such as tanks and pipes. The site has been extensively plumbed with an array of gas supply pipes and valves so that deliberate quantified leaks from 0.01 g/s to >100 g/s of CH₄ can be released on demand. The challenge for the equipment is to demonstrate the ability to detect, localise and quantify blind releases (unknown location and unknown release rate). One “non-blind” release with known flow rate was made, for calibration purposes, after which the leak detection equipment under test needed to identify the location, and calculate the release rate, of leaks generated over the site. Data generated by our TDLidar sensor during these trials has been very promising but for now we are only able to share preliminary results. Figure 1 shows some examples of data taken in these TADI tests. Figure 1a) is an image of a CH₄ plume overlaid on a full-colour image taken with an onboard visual camera. This represents a close approximation of the automatically generated images that are provided in QLM’s commercially released lidar and clearly shows the exact location of the leak. Figure 1b and c show the TDLidar sensor’s view of large and small leaks situated about a storage tank. Figure 1: TDLidar images of CH4 releases test at Total’s TADI platform. a) CH₄ plume image overlaid on full-colour background image from visual camera b) and c) CH₄ ppm.m plume images overlaid on the infrared signal level image.To reduce CH₄ emissions and slow global warming there is a widespread and growing need for effective and scalable CH₄ monitoring techniques that are deployable at industrial scale. Continuous monitoring of CH₄, as opposed to intermittent monitoring via surveys, offers the opportunity to enable and verify CH₄ emissions reduction programs by providing greater certainty in CH₄ budgets, eliminating estimation, and indicating where the greatest reductions can be made in the shortest possible time frame. Government regulations are rapidly changing to reflect this, and the oil and gas industry has committed to adopt a more effective CH₄ monitoring and reporting strategy. Continuous monitoring of emissions in the oil and gas industry is a major challenge due to the stringent cost requirements of the industry and the obvious need for high durability, long lifetime, and complete autonomy. QLM’s Quantum Gas Lidar technology meets these requirements, utilising mature, robust, and highly cost effective and scalable near-infrared telecommunications components in a unique configuration for spectroscopic Lidar. The technology provides highly accurate CH₄ concentration imaging using an active scanning technique that can cover ranges of hundreds of meters. QLM is continuing to apply this technology to industrial applications with the help of end users. The quantitative accuracy of the sensor, high quality of the multiple images it captures, and lack of background interferences, makes the leak detection and quantification reliable and autonomous. QLM’s lidar-based solution can be at the forefront of regulatory development, and provide operators with the means to both comply, and to reach ambitious Net-Zero carbon targets, on a readily available, cost effective platform.

September 15, 2020
Oil & Gas: Validation Of Emission Quantification Performance with  the National Physical Laboratory

Oil & Gas: Validation Of Emission Quantification Performance with the National Physical Laboratory

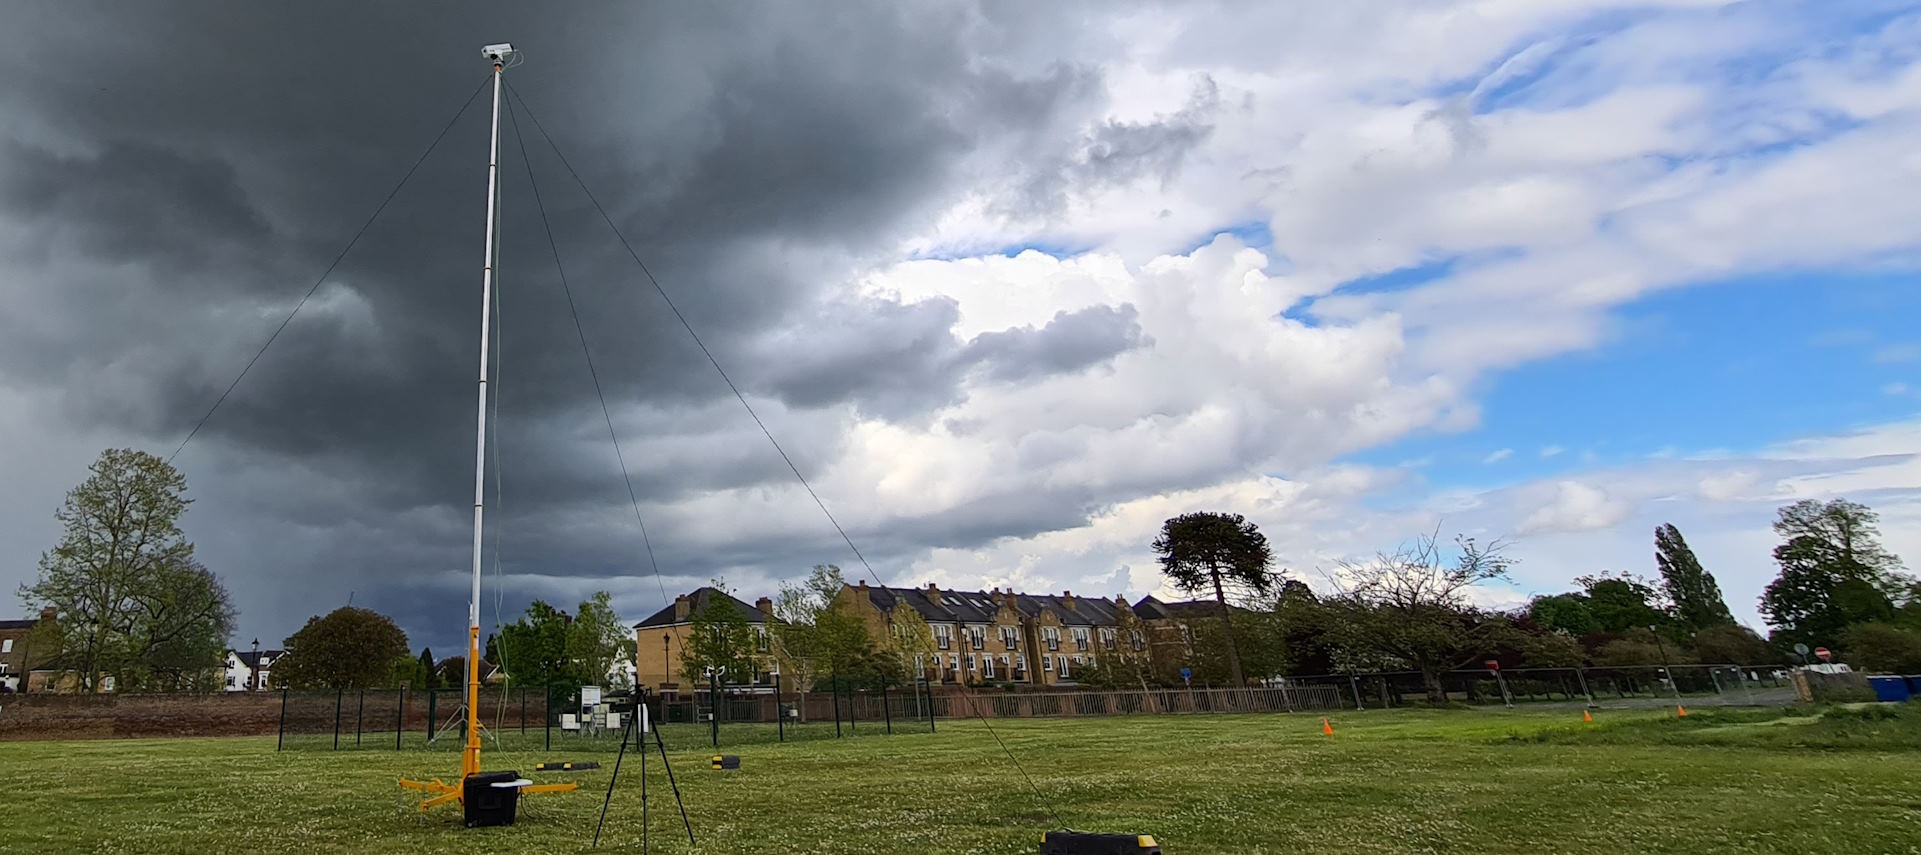
The adoption of new technologies into heavily regulated industries such as the oil and gas industry is intrinsically linked to rigorous validation of their performance. To this end, QLM has sought to carry out field testing of equipment against known, controlled releases of CH₄, both with recognised measurement institutes and industrial partners. QLM’s longest standing partner in these field tests is the National Physical Laboratory (NPL), the UK’s national measurement institute, who maintain their own controlled release facilities for the validation of LDAR techniques. A campaign of field trials was undertaken at NPL, with the prototype Quantum Gas Lidar was used to image controlled releases of CH₄ in an outdoor setting. The prototype Quantum Gas Lidar monitoring a controlled emissionMeasurements were made at a range of distances and release rates, in varying environmental conditions (both natural and artificial). NPL's own controlled release system¹ was used to control the release rate of CH₄. Figure 1a-b (below) illustrates the experimental setup for varied sensor range and flow rate measurements. The lidar was placed at several distances from a mounted release tube connected to a mass flow controller. CH4 was nominally released at between 0.012 g/s and 0.835 g/s (the mass flow controller used units of litres per minute, and these values corresponded to 1 L/min to 70 L/min). Measurements were taken from distances between 16 m and 90 m from the CH₄ release point with the sensor directed horizontally across a field and a backdrop of trees and a brick wall for laser scattering. The backdrop was around 15 m behind the CH₄ release point. Figure 1: Calibrated CH₄ leak imaging. CH₄ plumes of varying sizes were created with a calibrated piped CH₄ supply and measured at varying distances and environmental wind conditions. The experimental setup is shown in a) and b). Images c)-e) show examples of ppm.m plume images overlaid on the signal level image.Typical results from measurements in this configuration are shown in Figure 1c-e. Each image corresponds to a measurement time of approximately one hundred seconds (i.e. 10,000 of the 10 ms duration CH₄ readings). Releases of as low as 0.012 g/s were imaged from the shorter 16 m range. However, at longer ranges the relatively small solid angle occupied by the small leak made the probability of intersection with the sensor beam too low for detection within a reasonable timeframe. Releases of 0.056 g/s were imaged clearly from up to 30 m range, while the 0.835 g/s was easily detectable from 90 m. Based on the relative size and high ppm.m values detected in the 0.835 g/s release we estimate that this would be detectable at up to 200 m range, though due to the limited size of the field this was not verified experimentally. Larger CH₄ releases were easily detectable at the longer ranges, while shorter range measurements were able to detect and visualise even the smallest releases. The limitation in detection of small leaks at long range was caused by the spatial resolution of the laser system, rather than a lack of sensitivity to low ppm.m levels, or range of the optical transceiver system. It is expected that the detection of small leaks (0.01 g/s) at long ranges (hundreds of meters) could be achieved if the laser scanner directly intersected the plume. An important factor in imaging and quantifying gas emissions is the speed of the wind. Variable wind speeds were created using an artificial source in the form of a large fan, illustrated in Figure 2a. Figure 2: CH₄ leak imaging with controlled wind conditions. CH₄ plumes of varying sizes were measured at varying wind speeds. The experimental setup using a large fan to vary winds speed at the plume is shown in a) and b). Images c)-h) show example results for various combinations of wind speed and CH₄ flow rate.An anemometer was positioned in the path of the fan, close to the CH₄ source, to monitor the local air flow speed. This setup allowed simulated wind to be applied to the CH₄ source with speeds of 1 m/s to around 10 m/s. On this occasion, the sensor was deployed at height using a mobile elevated work platform (MEWP), looking down over a short distance perpendicular to the flow of wind generated by the fan as shown in Figure 2b. The background of the image was the grassy field around 13 m from the sensor. Release rates and artificial wind speeds were varied to evaluate the limit at which wind speed reduced the effectiveness of the measurement. The variation in wind produced an expected variation in the shape of the plume, clearly imaged by the TDLidar sensor. High wind velocity caused narrow and straight plumes, while lower wind velocity produced border plumes with a gentle curve towards the wind direction (Figure 2c-h). At higher wind velocities, some smaller releases are sufficiently diluted by the air flow to make them more difficult for the lidar to detect, resulting in less obvious visualisation and higher uncertainty in the flow rate calculation. It should be noted, however, that the artificially induced wind was constant, which is unlikely to be true of conditions experienced in real-world environments. It seems likely that capability to image the way the plume changes shape and density over time could provide information about the local wind speed² which would be useful for flow rate estimation. Flow rates were estimated using the simple mass balance algorithm applied to the entire data set acquired during the trial. An anemometer positioned at roughly 1 m height was used to record the wind speed with one-minute time resolution which was then used in the mass balance calculation. The flow rate estimation results for all tests at NPL using the TDLidar sensor are shown in Figure 3. This includes results from measurements with high (artificial) wind and long range. Figure 3: CH₄ leak flow rate measurement accuracy. Comparison of calculated leak flow rate and calibrated leak rate for all measurements during the NPL field trial.The correlation between calculated leak flow rate and actual leak flow rate is strong considering the simple flow algorithm and variety of wind speeds and ranges. Across the whole set there is an average percentage error of around 50 % between the estimate and the true flow value. We believe this can be significantly improved as we continue to refine the sensor performance and our flow rate calculations, but This continues to improve with the development of the lidar, but even these results indicate very good potential for accuracy at the level needed for effective industrial monitoring. [1] T. Gardiner, J. Helmore, F. Innocenti, and R. Robinson, “Field Validation of Remote Sensing Methane Emission Measurements,” Remote Sens., vol. 9, no. 9, p. 956, Sep. 2017, doi: 10.3390/rs9090956.[2] S. Jongaramrungruang et al., “Towards accurate methane point-source quantification from high-resolution 2-D plume imagery,” Atmos. Meas. Tech., vol. 12, no. 12, pp. 6667–6681, Dec. 2019, doi: 10.5194/amt-12-6667-2019.

August 15, 2019
The Details

Learn more about the core technology

Download the technical whitepaper and product brochure for full specifications, methodology and deployment detail.

QLM Quantum Lidar Methane Camera brochure